Embedding a Historical Map in HTML using JavaScript
You can display a historical map in an plain HTML file that you host from your own server, with layers that you can control. This embeds the Running Reality JavaScript engine and an OpenLayers web map to display any point and time in history.
Overview
Running Reality provides a wide range of options to share historical maps with your visitors and audience. The most control over the map is afforded by this JavaScript embedding approach, but it is also the most technically complex. We believe in creating the highest quality history resource for everyone and allow no-cost embedding so that sites can benefit from this collective data set and the history engine that brings it together. This JavaScript embedding approach lets you control the map interactively and make it more seamlessly integrate into your own site. Self-hosted stand-alone pages are often the required approach for University project pages or other publications and this approach fits perfectly with that requirement.
As always, when using the work of others, we ask that embedded content be provided with proper citation back to Running Reality so that Running Reality can provide the citation details for the data that went into the historical map you are using. A reference back to Running Reality also allows others to then see the set of citations used by Running Reality and its contributors. See our data use policy for more details.
If you are embedding Running Reality, a big part of what makes it valuable to you, your visitors, and the community is the range of accurate, audit-able historical data. In the era of Artificial Intelligence creating extensive but poorly sourced historical data, we believe in a solid foundation of historical data for all. In this spirit, if you are using Running Reality for embedding and overlaying your historical data, we hope you might consider making that data available to others by contributing it to the "baseline" Running Reality world.
Approach
This embedding approach uses a JavaScript library to inject the Running Reality history engine and map into an HTML page that you host. The map rendering is handled by an OpenLayers map that has been customized to render temporal data and is driven by the custom engine. You can not show the Running Reality map in another JavaScript map library, such as a plain OpenLayers map or a Leaflet, Mapbox, or ESRI. There is no static map to display -- the map is generated dynamically by the engine using our history data set. Because the map is in your HTML and not in an embedded HTML iFrame, you can interact with the map after it has been created. There is a small Application Programming Interface (API) that lets you change the map date, location, and zoom level with JavaScript and lets you add and remove map layers. The layers are any valid OpenLayers layer such as those you link (i.e. an OpenStreetMap) or generate (i.e. GeoJSON data).
Running Reality also provides other approaches to embedding that are simpler and may fit your needs and require less technical knowledge. This approach -- where you show the map embedded in your own HTML hosted on your own servers -- gives you the most flexibility to show your data or layers. Running Reality then does not host your data or layers and therefore does not maintain responsibility for the hosting. If you aren't showing data or layers, then a simpler approach might best fit your needs. Here is an overview of the full range of embedding options:
The map is injected by the Running Reality JavaScript library, rr.js that you must
load in your HTML. This is a small script that then pulls in the main Running Reality engine code.
The total download is going to be about 300kB of compressed JavaScript (about 800kB uncompressed)
plus about 200-800kB of history data (more if more complex national borders are visible) and about
200kB of map tiles (in the WebP format unless using an older browser, then using the larger PNG format).
Example
This is some example code to help you embed Running Reality in an HTML page. The full example can also be downloaded from the link below to make it easier to get started.
Example HTMLFirst, it is required that you include the Running Reality JavaScript library, rr.js
Place the script tag in your HTML document's header. You can also use a meta
parameter to set the initial map location coordinates, date, and zoom level. The rr:location
meta tag follows the format of the URL hash parameters defined on the main embedding page.
<script src="https://www.runningreality.org/lib/rr.js"></script>
<meta name="rr:location" content="#01/01/1005BC&36.609,24.9706&zoom=4">
Next, you must add an HTML DIV tag for the map injection point, with the attribute id="rr-embedded".
Place the DIV tag in your HTML document's body, wherever you want he map to appear. The rr.js
script will inject the map here when the page has loaded.
<script src="https://www.runningreality.org/lib/rr.js"></script>
<meta name="rr:location" content="#01/01/1005BC&36.609,24.9706&zoom=4">
Changing the map's user interface is more complex than when using iFrame embedding. Instead of putting parameters in the iFrame URL, you will have to use Cascading Style Sheets (CSS) directives to turn on and off user interface features. The primary features to turn off are the timeline and sidebar and these example CSS directives will do that:
#rrmap {inset:0px !important;top:0px;}
#rrtimeline {display:none;}
#rrsidebar {display:none;}
#rrsidebar {display:none;}
Because the map is an OpenLayers map, you can style individual OpenLayers user interface items with OpenLayers CSS directives. This example turns off the location control, but you can also use CSS to reposition or change the look.
.ol-location-control {display:none;}
This example JavaScript code below adds two layers to the map. First it defines an GeoJSON layer using embedded
data (you can also use a URL to a GeoJSON file), then adds it with an opacity of 40%. For this layer,
a style must be supplied and so the code defines a very simple black and white point style with a
label. Second, the code adds an OpenStreetMap layer, with an opacity of 30%. These layers are just
examples of how to add layers of different types to the embedded OpenLayers ol.Map
You may choose to use any layer type available from OpenLayers and any style or style function.
const layers = [];
const pointStyle = new ol.style.Style({
    image: new ol.style.Circle({
        radius: 7,
        fill: new ol.style.Fill({color: 'white'}),
        stroke: new ol.style.Stroke({color: 'black', width: 2}),
    }),
    fill: new ol.style.Fill({color: '#FFFFFF22',}),
    stroke: new ol.style.Stroke({color: 'black', width: 2}),
    text: new ol.style.Text({offsetY: 14}),
});
const pointStyleF = function(feature) {
    pointStyle.getText().setText(feature.get('Name')?feature.get('Name'):feature.get('name'));
    return [pointStyle];
};
const embedded_geojson_6095 = {
    "features": [
        {
            "properties": {"Name": "London"},
            "type": "Feature"
            "geometry": {
                "coordinates": [-0.0906,51.5125],
                "type": "Point"
            },
        }
    ],
    "type": "FeatureCollection"
};
layers.push( new ol.layer.Tile({source: new ol.source.OSM(),opacity: 0.300000}));

layers.push( new ol.layer.Vector({source: new ol.source.Vector({
    features: new ol.format.GeoJSON().readFeatures(embedded_geojson_6095, { featureProjection: 'EPSG:3857' }),
}),opacity: 0.400000, style: pointStyleF}));
layers.forEach(function(layer){rr.map.addLayer(layer);});
Finally, it is recommended to put the layer code in a timer to run after the page loads, so that the map will have time to set up. This is an example:
window.onload = function () { setTimeout(function() {
    /* layer code goes here... */
}, 2000);};
The full example code is linked above for you to download and adapt as you need.
API
The rr.js library makes available the following Application Programming Interface (API)
with which you may control the map, its date and location, and its layers.
| API | Purpose |
|---|---|
rr.map
| A handle to the OpenLayers ol.Map object, which gives you access to all OpenLayers features. |
rr.map.addLayer(ol.Layer layer)
| Add an OpenLayers ol.layer.Layer to the map, from a data source like a GeoJSON file or an OpenStreetMap server. |
rr.setDate(String dateInRRFormat)
| Change the date of the map. The date must be in the Running Reality date format, MM/DD/YYYY, which uses the U.S. date order with month first. For BC or BC dates, use the format MM/DD/YYYYBC |
rr.setLatitude(double latitudeInDegrees)
| Change the latitude of the map, value may be in the range from -90 to +90. |
rr.setLongitude(double longitudeInDegrees)
| Change the longitude of the map, value may be in the range from -180 to +180. |
rr.setZoom(int zoom)
| Change the zoom of the map, from value may be in the range 1 to 20. |
rr.increaseDay()
| Change the date of the map one day forward in time. |
rr.increaseMonth()
| Change the date of the map one month forward in time. |
rr.increaseYear()
| Change the date of the map one year forward in time. |
rr.increaseDecade()
| Change the date of the map one decade forward in time. |
rr.increaseCentury()
| Change the date of the map one century forward in time. |
rr.decreaseDay()
| Change the date of the map one day backward in time. |
rr.decreaseMonth()
| Change the date of the map month day backward in time. |
rr.decreaseYear()
| Change the date of the map one year backward in time. |
rr.decreaseDecade()
| Change the date of the map one decade backward in time. |
rr.decreaseCentury()
| Change the date of the map one century backward in time. |
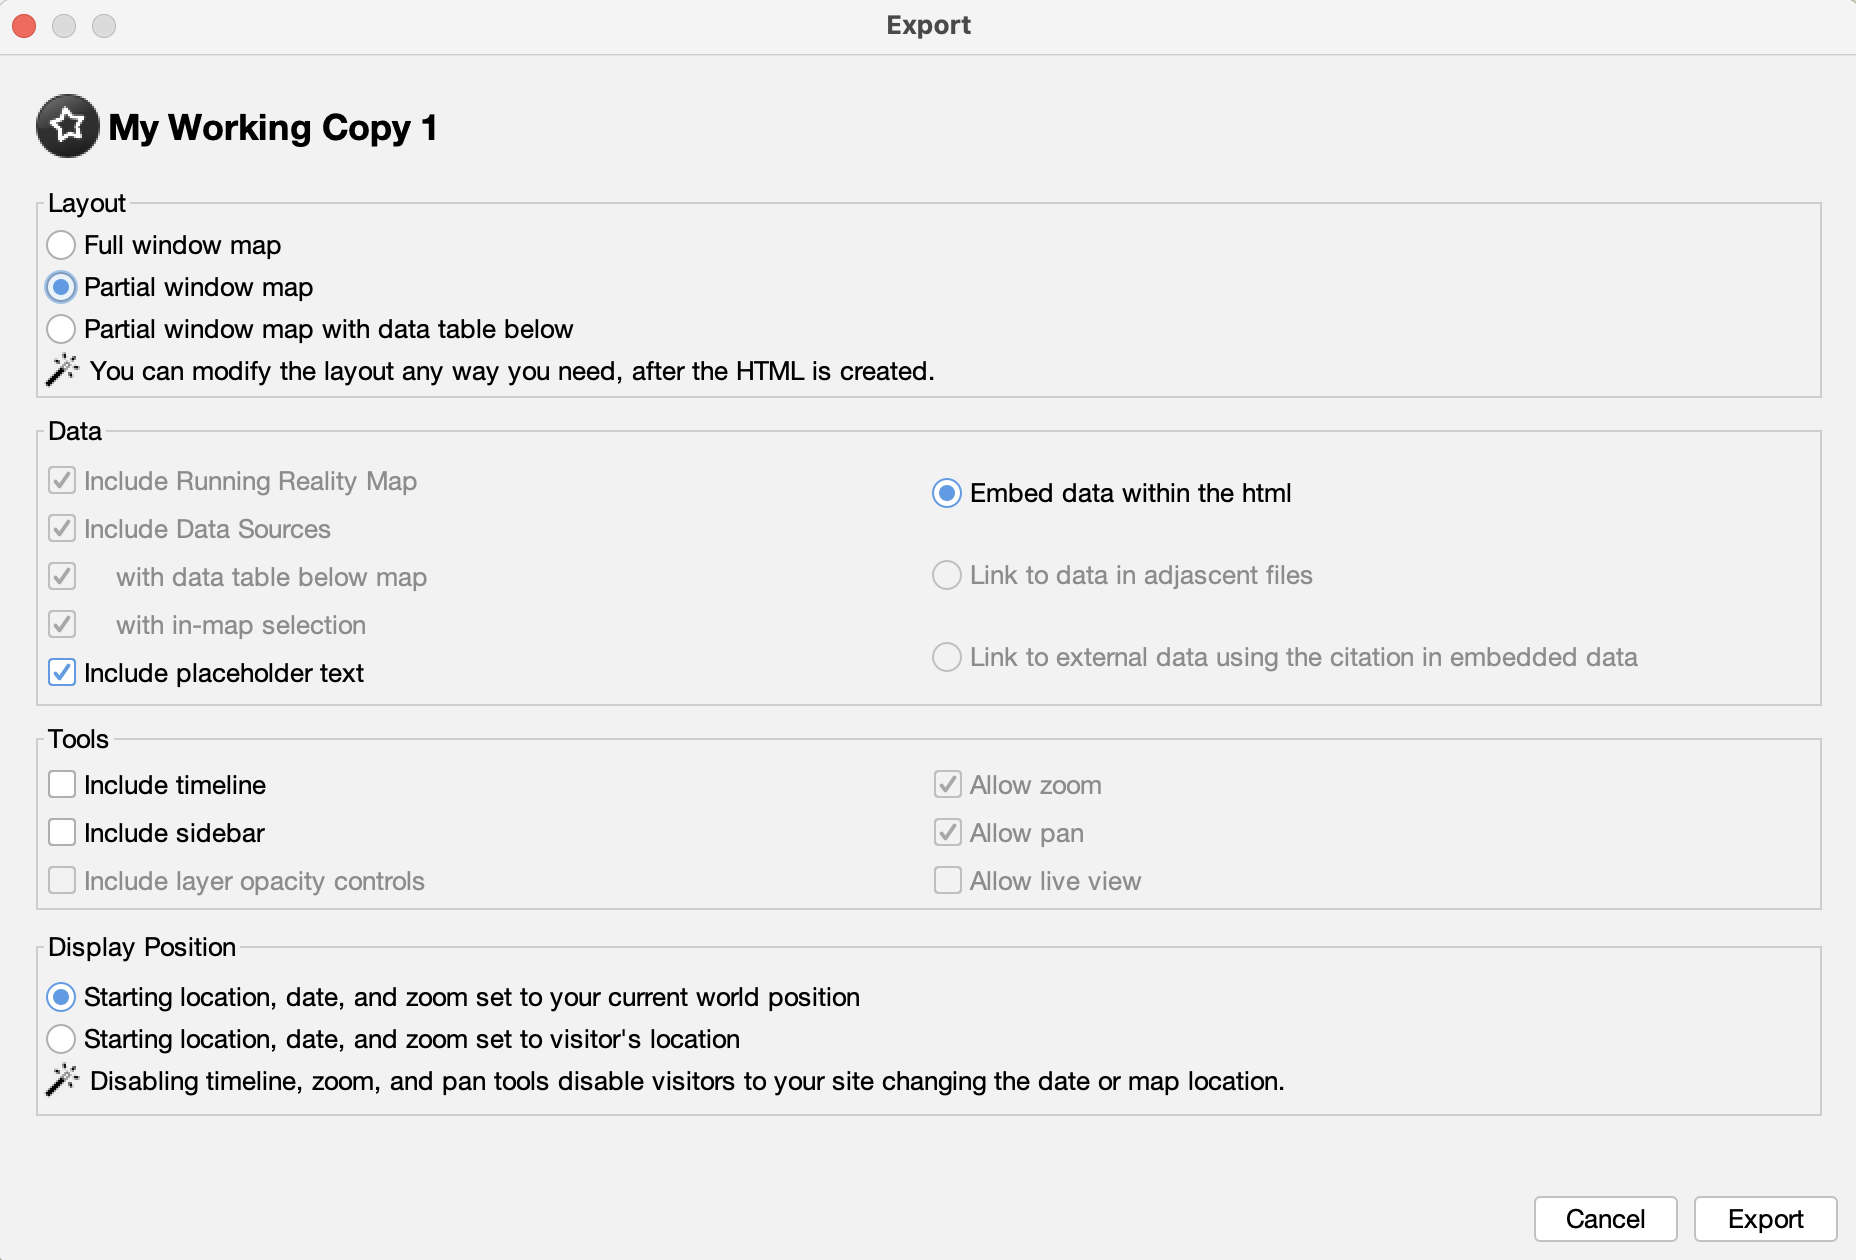
World Export
From the world menu of the desktop app version of Running Reality, there is an
option to export a world to a standalone HTML page. There are many configuration options to
include your raw layer data within that HTML page, including any GeoJSON layers or CSV, XLS, or
SQL tabular data. This produces an HTML page that complies with specifications above on this
page, using the JavaScript embedding and API. It has the advantage of making layer integration
easier if you are already using your data layers in the desktop app. If your Running Reality
world in the desktop app has an OpenStreetMap layer and a GeoJSON data layer, the app's world
export will produce an HTML page that also has an OpenStreetMap layer and your data embedded. This
HTML file can be used directly or as a convenient template from which to build a more elaborate and
interactive page. The exporter also has the option to include a data table below the map, if desired.
Feedback
If you can not find an answer here, please feel free to ask us for help. Send us an email if you would like us to get back to you with a response:
Send the Running Reality team an email: